
Our Claude Max plan kept reaching 100% of its limits, far sooner than the work we did seemed to justify. The weekly window hit 100% on 18 October (before the chart below begins), and the five-hour window followed on 21 and 22 October.
We checked our usage records and found the pattern behind it: long sessions re-read their entire history on every tool call. This post shows our numbers and ends with what you can change today.
What did the chart show?
Our Second Brain app draws how much of the plan we have used over time. It has two lines: the five-hour window (blue) and the seven-day window (white). These correspond to the plan's session limit and weekly limit.
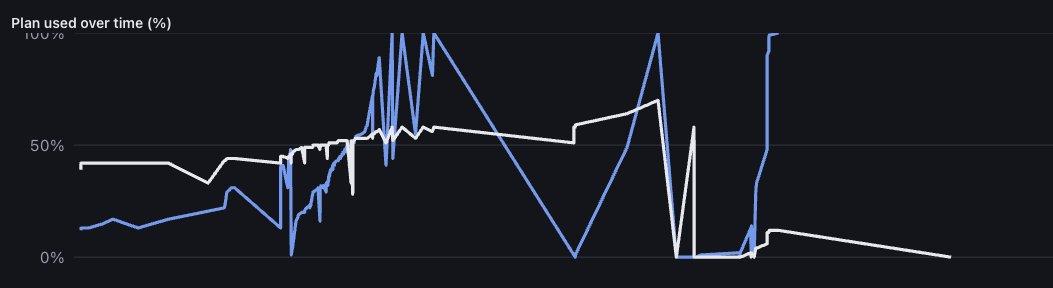
The blue line swings from near zero to the ceiling and back. That shape tells you the plan filled, but not why. To find the cause, we queried the records behind it: our usage ledger logs model calls with their token counts, so we could ask where the tokens went.
Why does a long session cost more than the words in it?
Two terms first. A token is the unit of text a model counts. A session is one running conversation with Claude Code, including everything it has read and done so far.
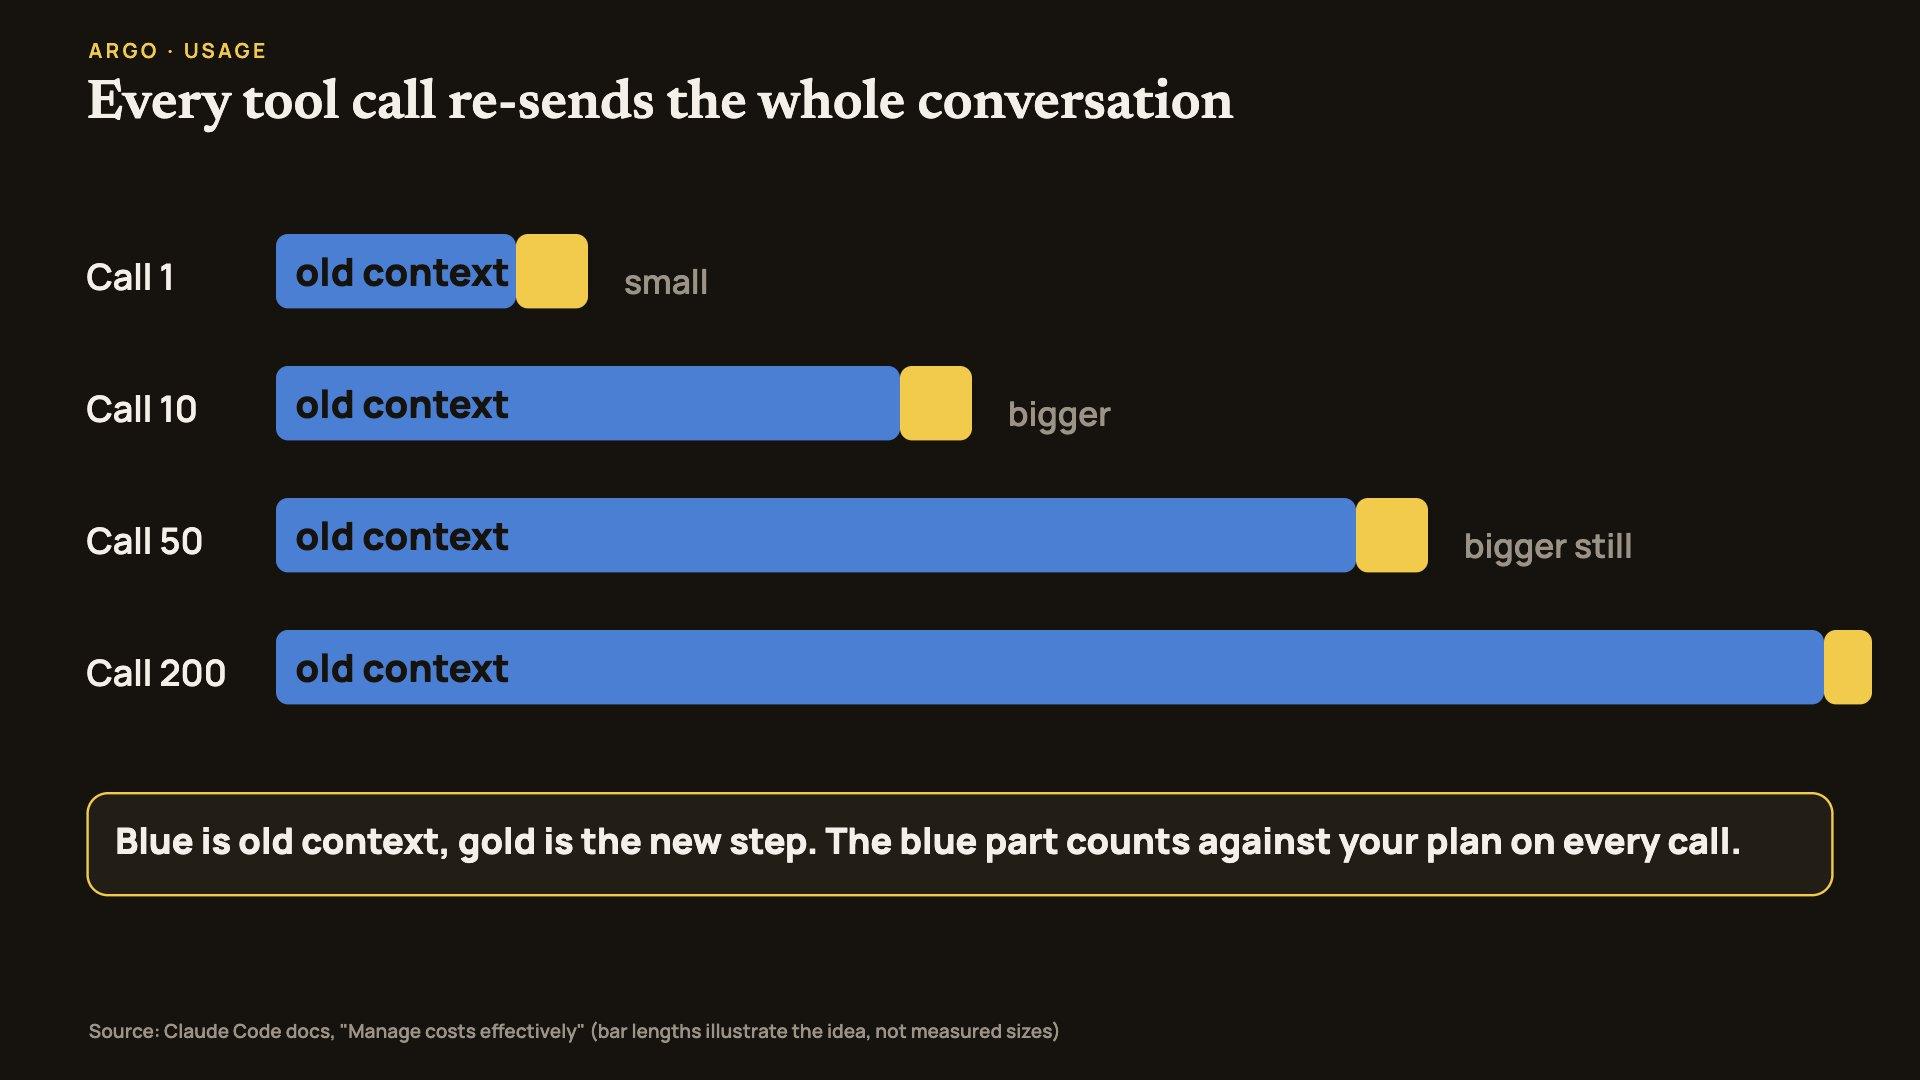
Claude Code does not send only your latest message. It sends the whole conversation with every request, and each time Claude uses a tool (reads a file, runs a command), that is another request. The Claude Code docs put it this way:
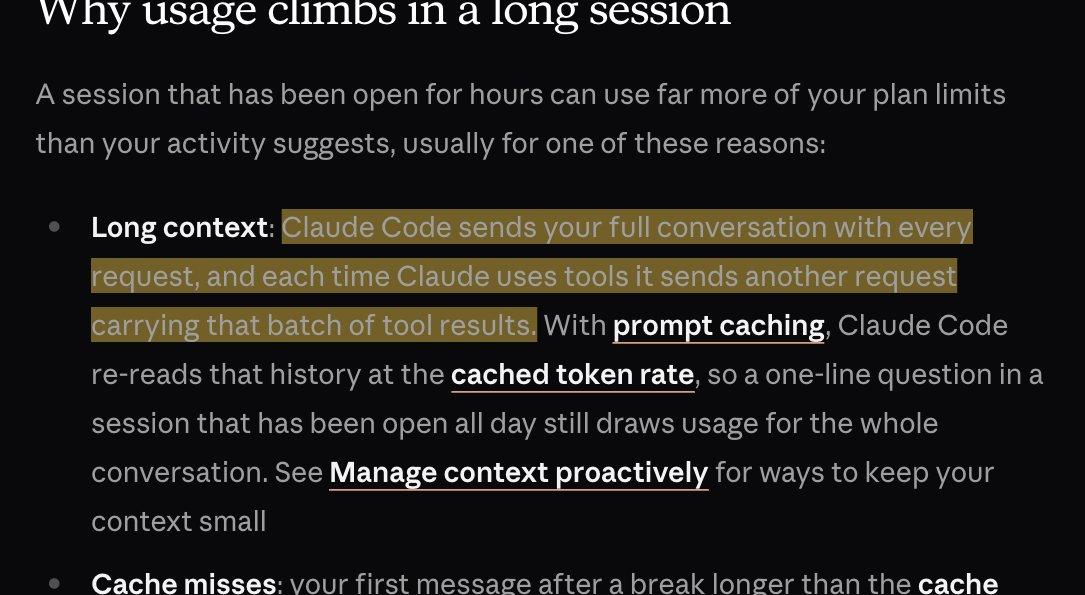
To keep this affordable, the history is stored in a prompt cache (a short-term copy of text the model has already processed, so it doesn't have to be processed again). Reading from the cache is much cheaper per token than reading fresh input: Anthropic's API pricing (the interface Claude Code uses under the hood) lists cache reads for Opus 5.5 and Sonnet 5.5 at 0.05 times the base input price. That is a large discount, and it is also why this problem hides. Each cheap read looks harmless. The count is what hurts.
Think of a lawyer who must re-read the entire case file before answering each question. Reading is fast, but if the file is 300 pages and you ask 200 small questions, most of the effort goes to re-reading. The analogy stops working in one place: the cost is not time but the share of your plan that each re-read uses.
What did our own numbers say?
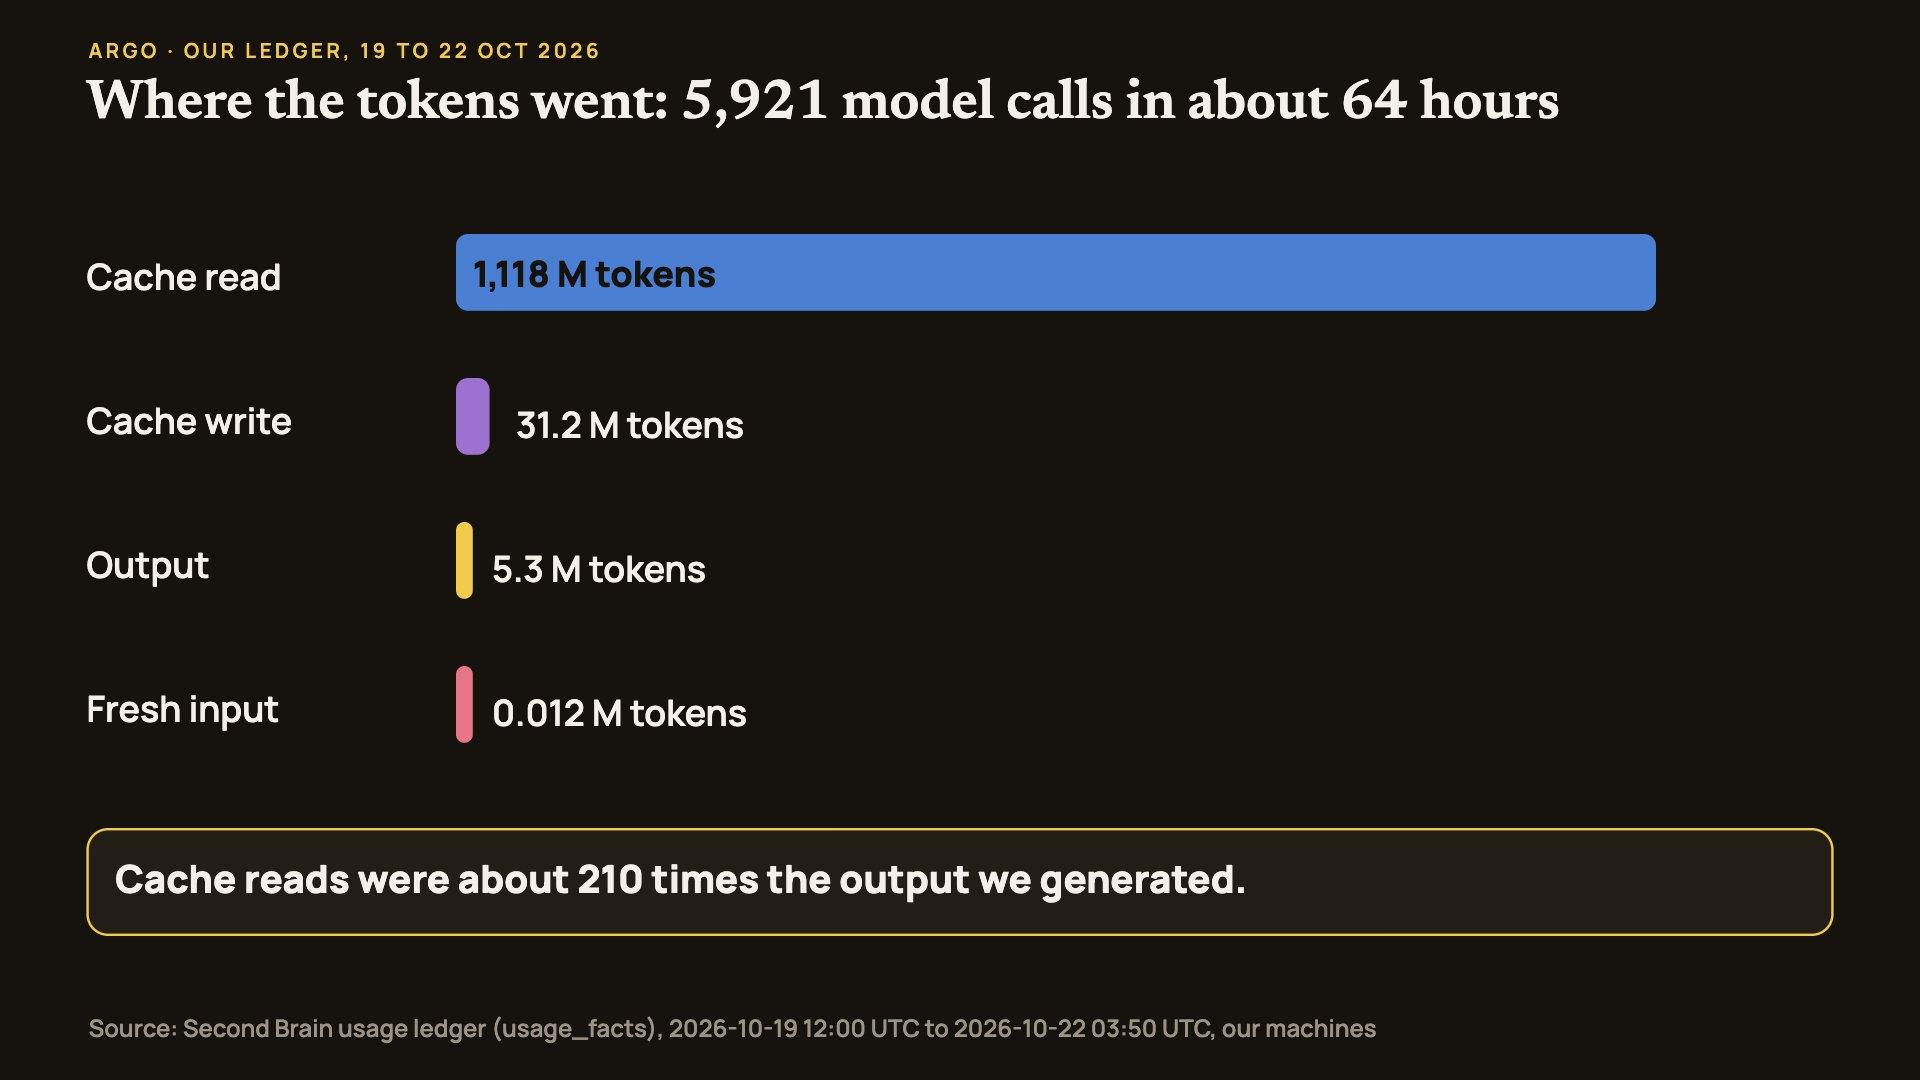
Our three machines logged 5,921 model calls across 129 sessions between 19 October 2026 (12:00 UTC) and 22 October (03:50 UTC).
- Cache reads: 1,118 million tokens.
- Cache writes: 31.2 million tokens.
- Output: 5.3 million tokens. This is what Claude produced, including its tool calls and thinking.
- Fresh input: about 12 thousand tokens.
Cache reads were roughly 210 times the output. Claude was not producing unusually large answers. It was re-reading.
The size of the history explains the ratio. The median call carried 171 thousand tokens of context. 2,202 calls (37%) carried more than 200 thousand, and 377 carried more than 400 thousand. The ledger does not record how long each session was open, but we infer that contexts that large come from sessions left running for hours.
Usage was also concentrated. The ten biggest of the 129 sessions made up 62% of all cache reads.
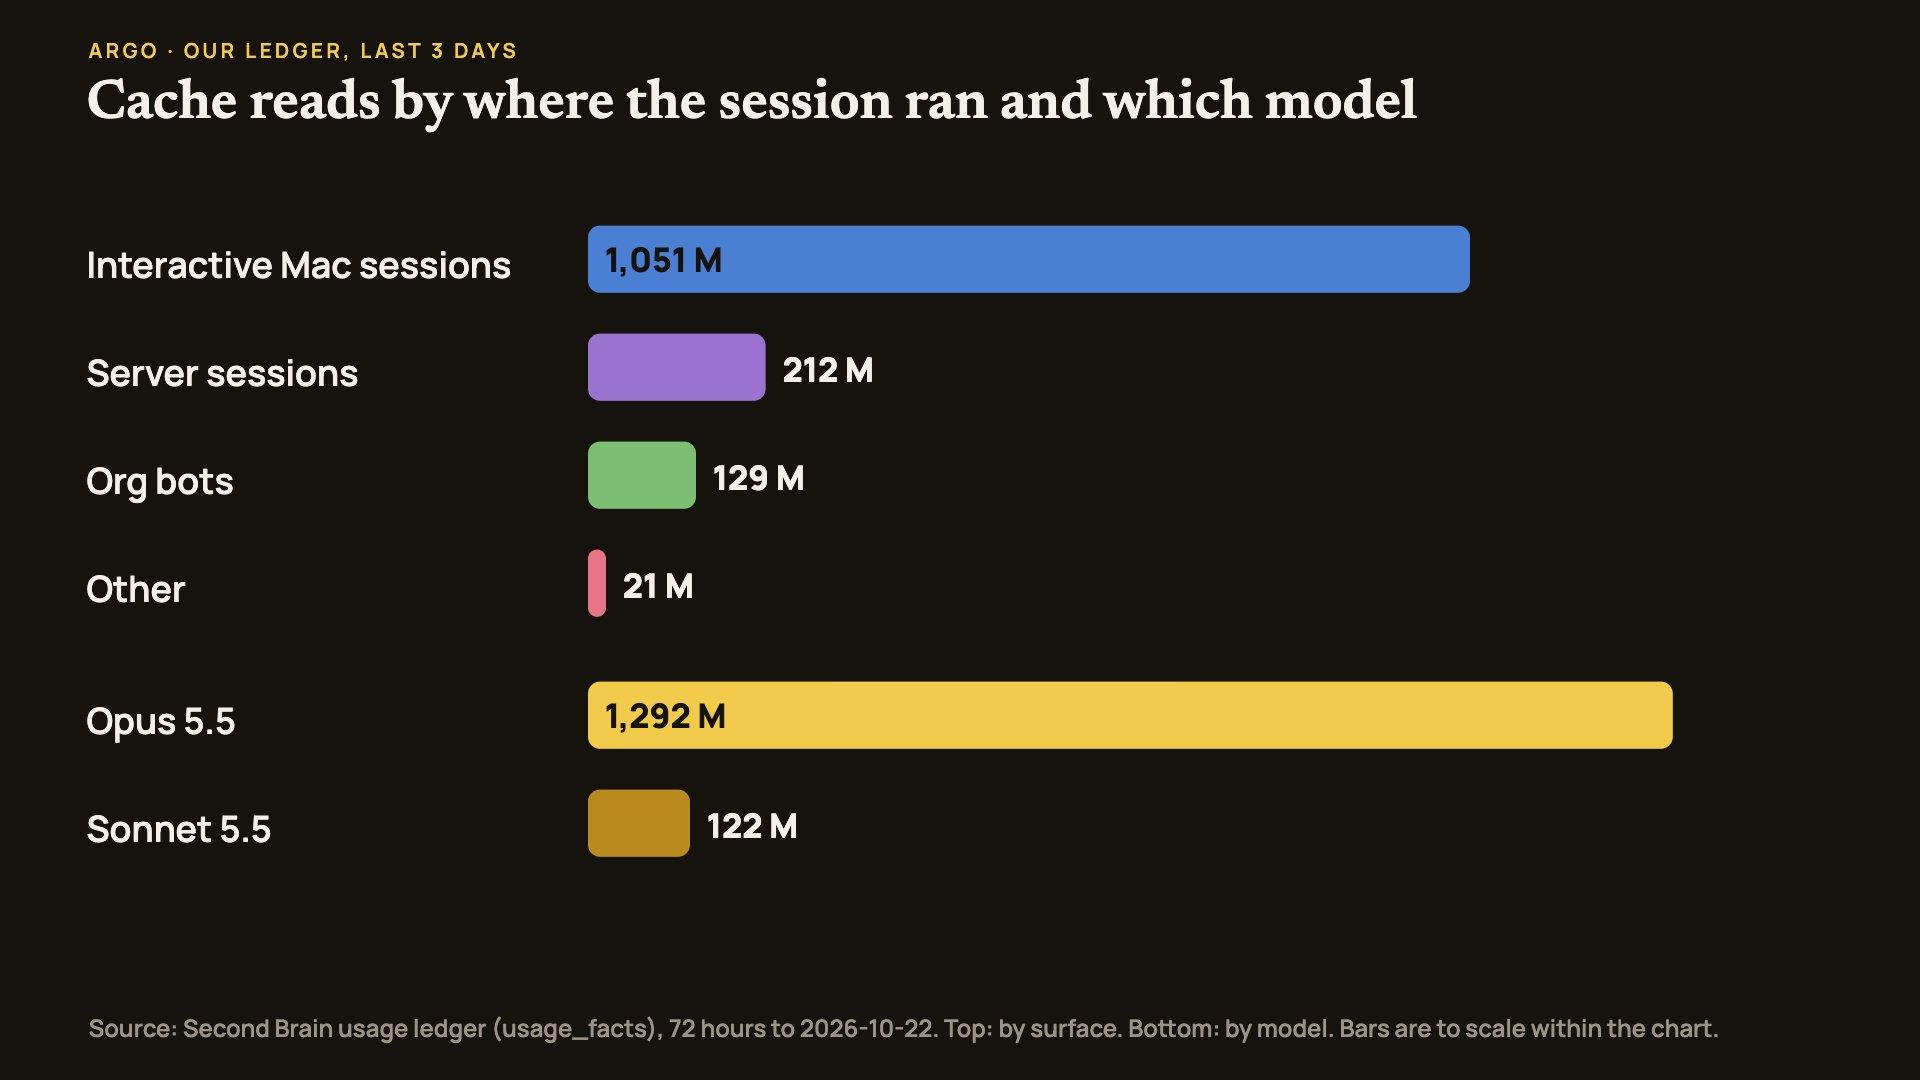
For the 72 hours to 22 October (a slightly longer window than the one above), the split by where the work ran was clear:
- Interactive sessions on the Mac: 1,051 million cache-read tokens, about 74% of the total. Almost all of it, 1,049 million, was on Opus 5.5.
- Sessions on our server: 212 million.
- Our org bots (agents that wake for a task): 129 million.
- Opus 5.5 overall: 1,292 million, about 91% of all cache reads. Sonnet 5.5 had 122 million.
Two out of three calls in that window were tool calls running shell commands. That matches how an agent works: read, run, check, run again. Each step is another request carrying the whole history.
One more number: 58 calls wrote more than 100 thousand tokens to the cache at once, adding up to 10 million of the 31.2 million cache-write tokens. In 21 of them, the call read almost nothing from the cache. We infer this means the whole history was processed again from scratch.
What makes it worse?
Several things make a long session drain a plan, and the Claude Code cost docs cover each. Our ledger shows the first clearly and cannot speak to most of the rest.
- Long context. Shown above, and the largest pattern we can see in our ledger.
- The biggest model. The docs' cost page advises Sonnet for most coding tasks and Opus for complex ones. Nearly all our cache reads were on Opus.
- A long rules file.
CLAUDE.mdloads at the start of every session and so is part of the history on every call. The docs suggest keeping it under 200 lines and moving workflow-specific instructions into skills, which load only when used. We have not measured ours.
The documented causes below we did not measure:
- Cache misses. Your first message after a break longer than the cache lifetime misses the cache and reprocesses the full context. By default the API's cache lifetime is 5 minutes (Claude Code can use a longer one), and it is refreshed each time it is used.
- Scheduled tasks. A recurring task inside a session fires on its schedule even while you are away, and sends your full context each time.
- Subagents. Every subagent sends its own requests on top of the main conversation's. Only 35 calls in our window launched a subagent, and we did not count the subagents' own requests.
- Compaction.
/compacthas to read the whole conversation to summarize it, so compacting a huge context is itself a huge request.
What can't we tell from our numbers?
We can count tokens. We cannot see how Anthropic weights each kind of token against a Max plan limit, so we make no claim about how many cache reads equal one percent of the plan. We also cannot say which single request pushed a window to 100%. The ledger shows the pattern that fills a plan, not the last drop.
What should you do?
You may see advice to create a .claudeignore file to exclude large folders. The Claude Code cost docs do not document one, so we would not count on it. The levers the docs do document are these:
- Clear between unrelated tasks.
/clearcosts nothing. The docs say stale context wastes tokens on every following message. Use/renamefirst if you want to come back with/resume. - Compact before the context is huge. The docs' own usage recommendations include “compact before you step away”. Because
/compactreads the whole conversation, compacting a large context is itself a large request. - Watch your context size.
/usageshows a plan breakdown with recommendations, and/contextshows what is taking space. Check your own: our median call carried 171 thousand tokens. - Match the model to the job. Use Sonnet for routine edits and keep Opus for hard design problems.
- Write specific requests. “Add input validation to the login function in
auth.ts” reads a file. “Improve this codebase” triggers broad scanning. - Filter output before it enters the conversation. A hook (a small program that runs before a tool call and can change it) can turn a 10,000-line log into the matching error lines.
- Keep
CLAUDE.mdshort. Move specialized instructions into skills. - Count your helpers. Each subagent sends its own requests, and scheduled tasks send your full context even while you are idle.
What's built and what's next
Built: the usage ledger and the usage page described above, including the plan-window snapshots. They are what let us find this. Not built: any guard that warns when a session's context passes a threshold, or that stops a long session automatically. We are writing a list of changes to our own Second Brain to catch this earlier, and we will publish what we ship.
A long session hides its cost behind cheap cache reads that add up. Keep the context small and the plan lasts longer.
Follow along on the blog or at https://x.com/myargoquest.